
In my previous post I presented a visualization of the Wikileaks mirrors spread of December 8th.
While it is interesting to see the spread of a certain day, it is even more interesting to see how the spread is evolving over time. By keeping track of updates of the mirror page on Wikileaks, I was able to collect enough data for an animated version of the spread. My current dataset contains a 7 day period covering December 5th to December 12th.
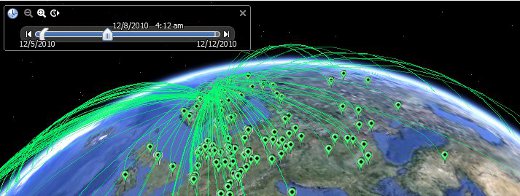
As some of the commenters pointed out, the edges (curves) in the previous dataset didn’t always followed the shortest path. This was due to the (simple & stupid) algorithm I was using to draw the path between two points (basically just the mathematical shortest distance). In the latest dataset (download link is at the bottom) this is corrected. In particular this website: http://www.movable-type.co.uk was very useful for figuring out the the correct path.
* update 21-12-2010 11pm CET *
– Got featured on ReadWriteWeb, Thanks!
* update 23-12-2010 10pm CET *
– Embedded Google Earth web plugin in demo section
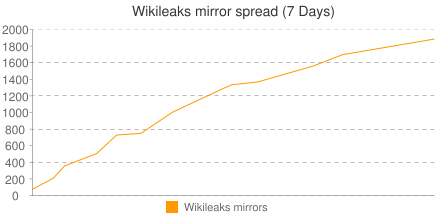
Mirror spread
The result of plotting the spread in a line chart:
Top 10 locations
An overview of the spread based on country:
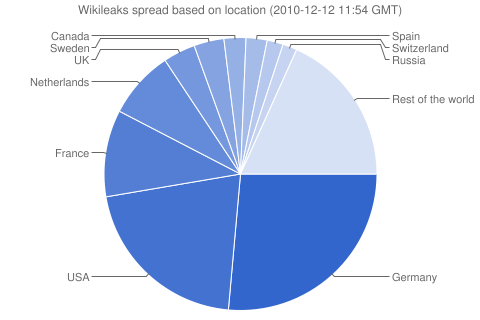
- Germany: 498
- United States: 394
- France: 194
- Netherlands: 152
- United Kingdom: 72
- Sweden: 67
- Canada: 49
- Spain: 47
- Switzerland: 36
- Russian Federation: 32
Screencast / Video
Short screencast (Watch it in HD 720p, in fullscreen mode)
Online Demo
To view this demo you will need to install the Google Earth Browser Plug-in
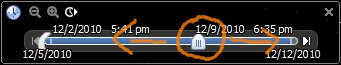
Note: You need to move the range marker all the way to the left to make the timeline work:
- Move the time slider all the way to the right
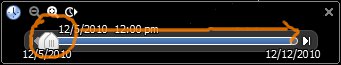
- Move the range marker (the small attachment on the left of the time slider) all the way to the left
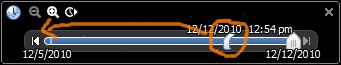
- Now you can move the time slider as you want
KML source
If the online demo doesn’t work for you, you can also try it in Google Earth!
- Make sure you’ve installed Google Earth.
- Next download and unzip the file following file: Wikileaks Google Earth KML files (Animated)
- Open up the KMZ file.
- Enjoy!


4 responses
Hi Laurence! Good work! I’m interested in how you created the chunks for the great circle definition in KML? I understand that, if only a start- and end-point is used, the arc will go below the terrain surface. All the best, Ola
Hi Ola, thanks! I recommend downloading the KML source file and opening it up in a text editor. Basically I’m drawing a LineString from the Source (S) to the Destination (D). By setting the altitudeMode to absolute, I can specify the height of a point in the LineString. So if I want to draw a line from S to D, I first try to find the midpoint. After calculating this point, I set the height depending on the distance from the source to the destination. By increasing the number of points (of the LineString) between S and D, I can make the line slowly increase or decrease creating the nice curve.
Great stuff man! But isn’t it a little revealing to Wikileaks’ enemiee?
It’s created with data that was freely available… so I’m sure that if someone wanted to take it down, they could’ve collected all IPs just like I did.