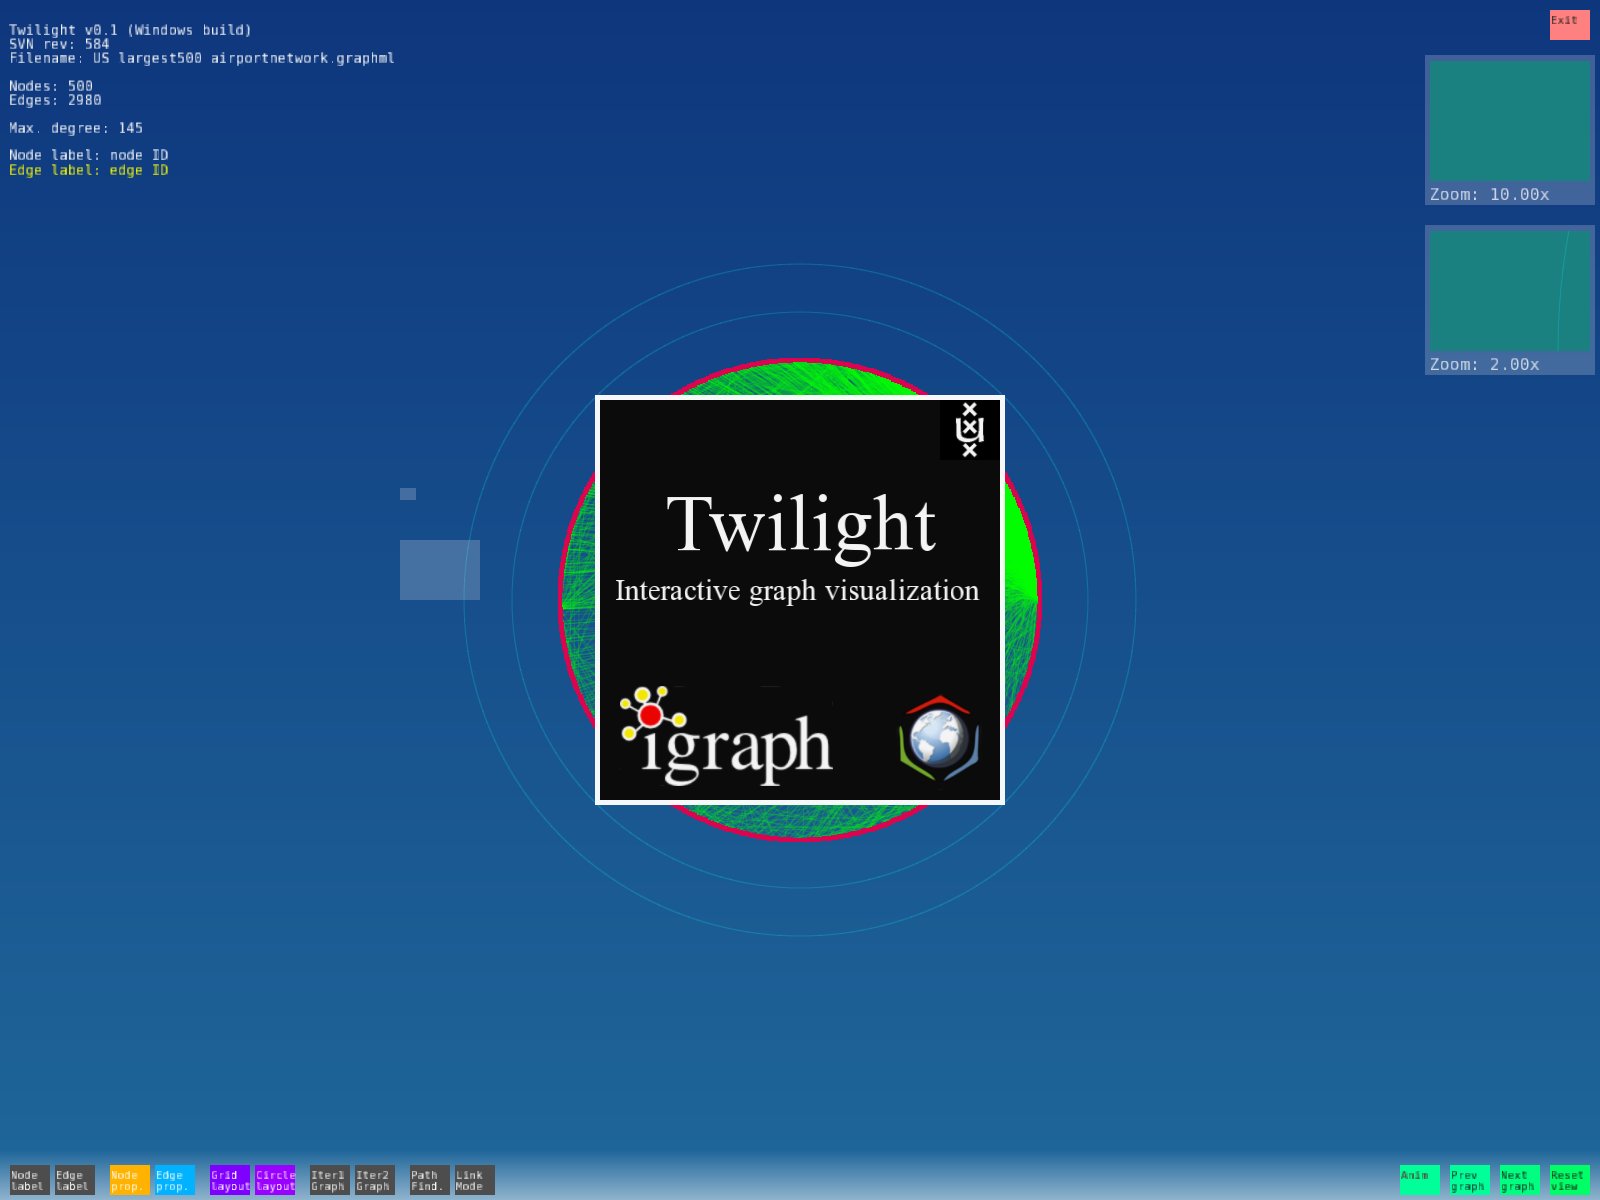
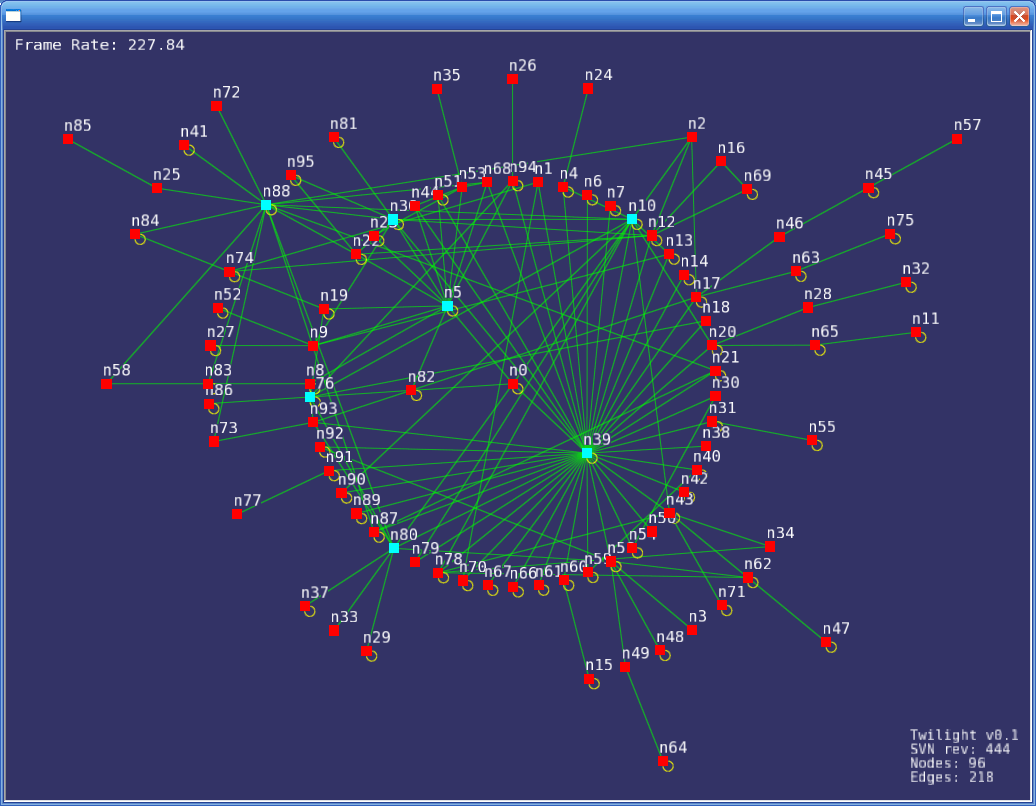
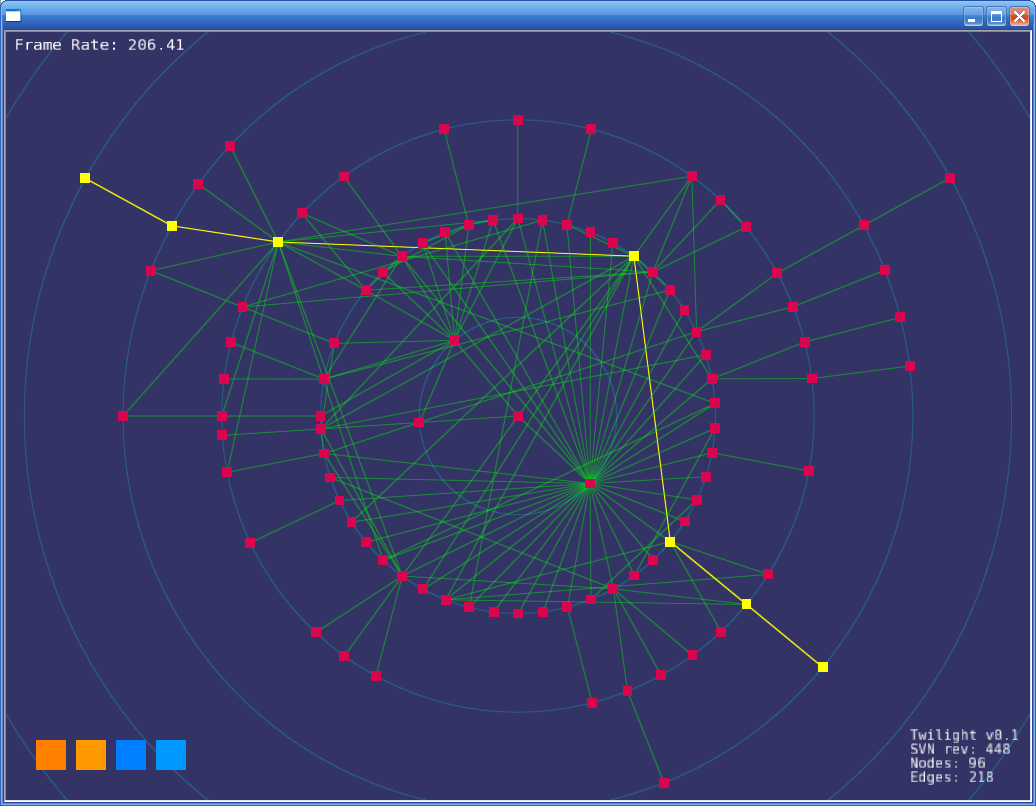
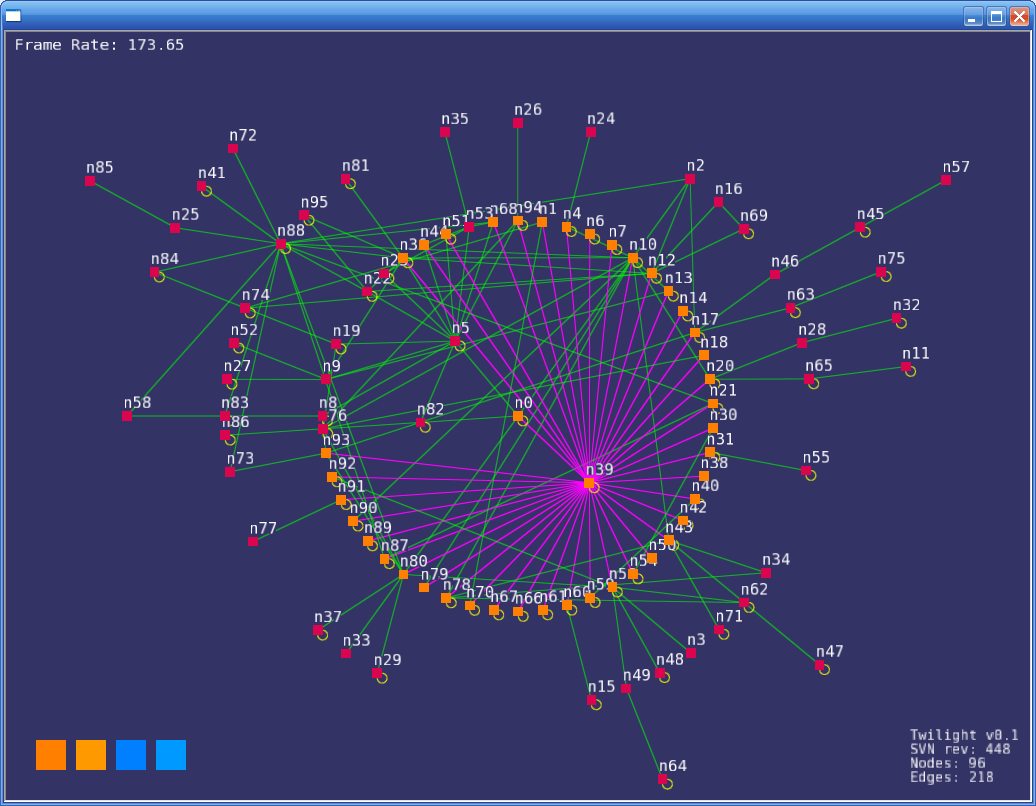
Twilight is an interactive graph exploration tool for multi-touch systems. Twilight provides a flexible environment that can be used to visualize and analyse graphs and networks found in the computational science. It was designed for visualizing large graphs from the following projects: Drug resistance in HIV mutations and transmission of infectious diseases (Virolab), Protein-protein interaction (VEARD) and Ontologies (ACGT). The interactive environment allows users to manipulate the layout in order to detect structures and patterns.
The project was used on the UvA Multitouch table (UvA/MMT). The UvA/MTT, developed at the Section Computational Science, combines graphics rendering with a multi-point input device to allow for direct interaction with graphical applications.
Project details
Project name: Twilight
Project members: Laurence Muller, Robert Belleman, Peter Sloot, David van Dijk
Published paper(s): none
Employer: University of Amsterdam / Scientific Visualization and Virtual Reality Research Group
Date: 2008/2009
Used technologies: C++/OpenSceneGraph/igraph/TUIO. The MS Surface version uses a TUIO proxy (Surface SDK).
Pictures
Twilight running on the MS Surface
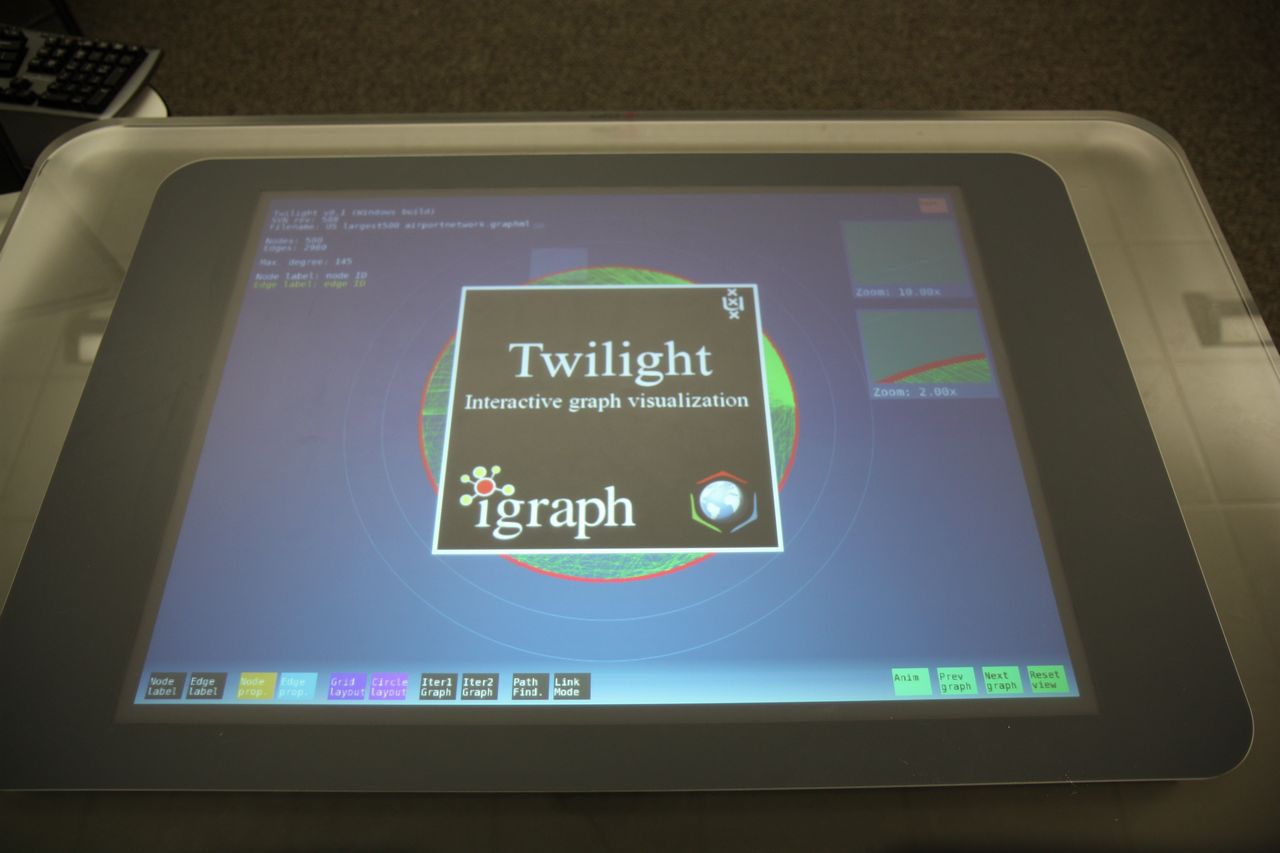
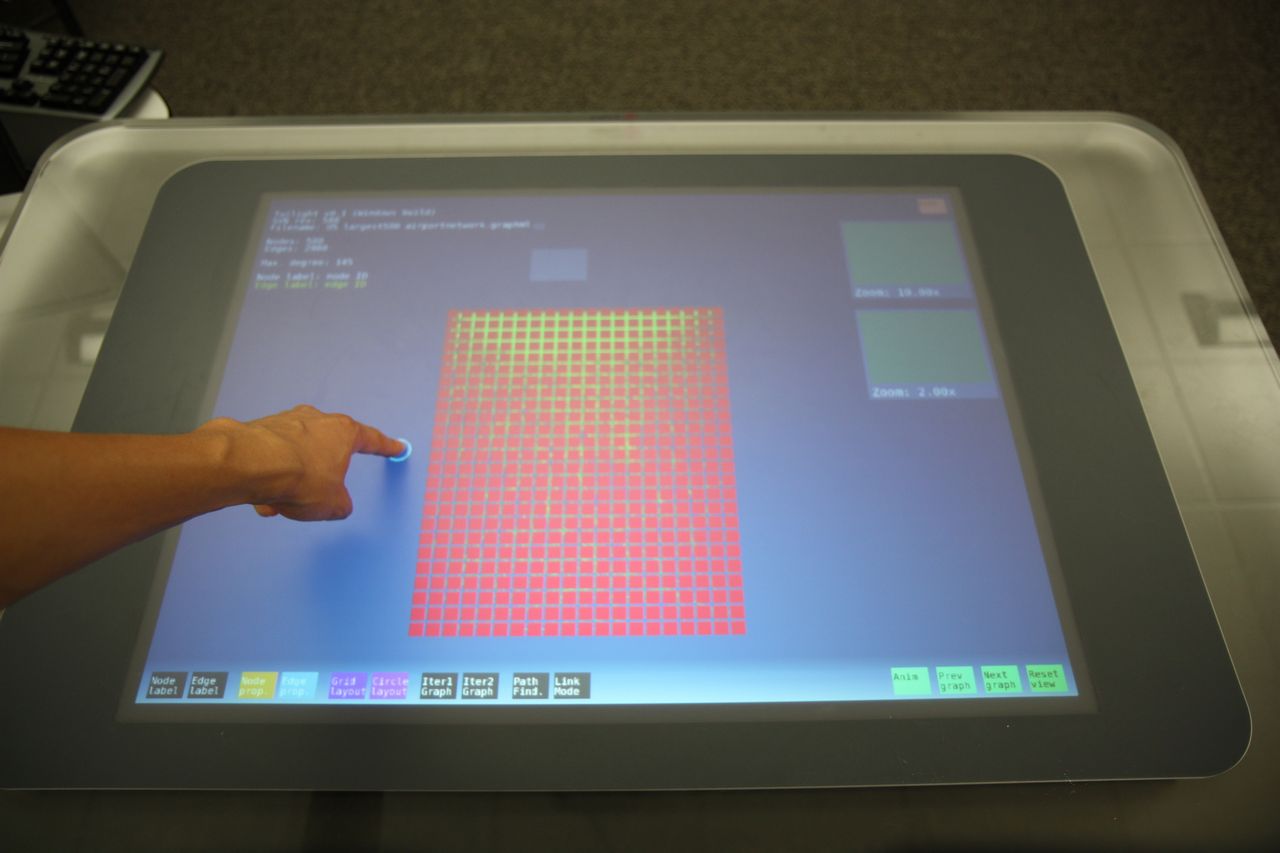
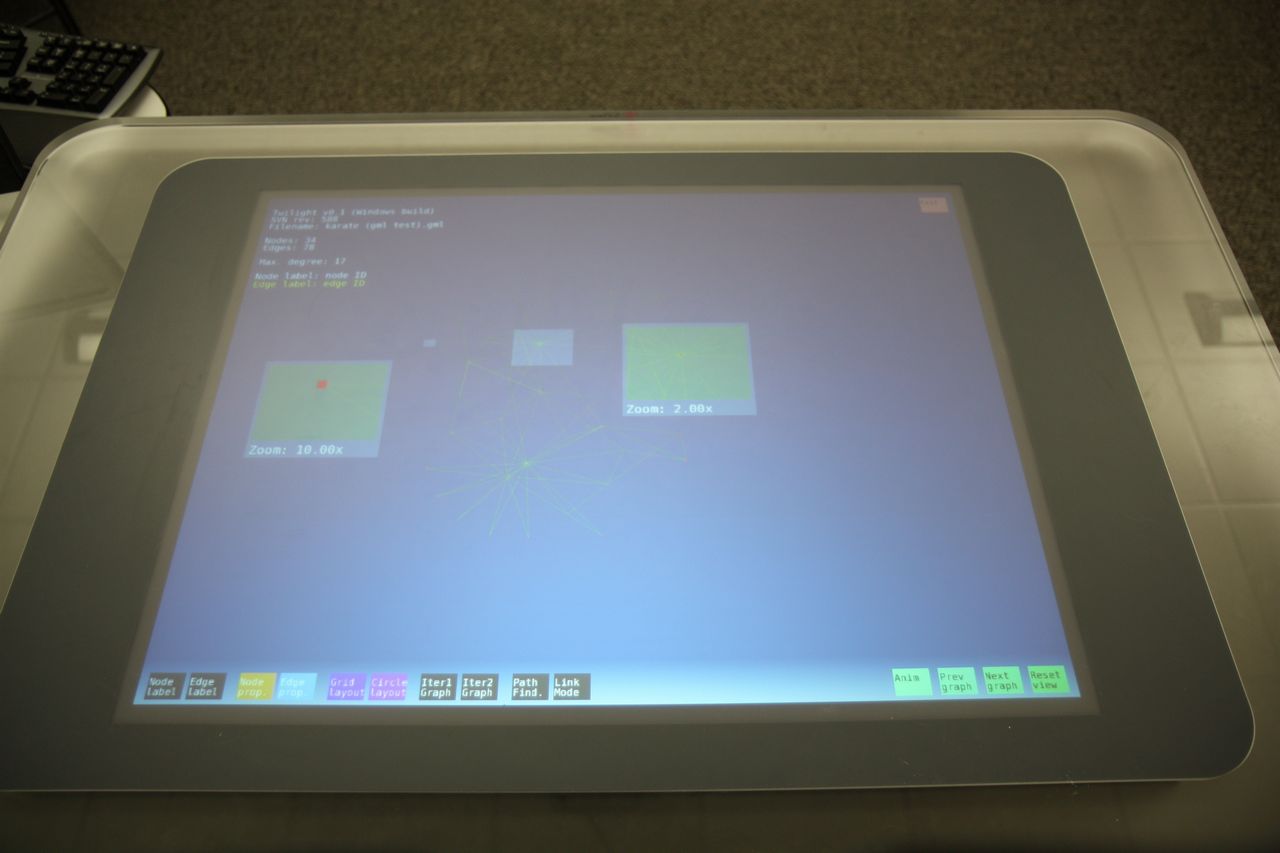
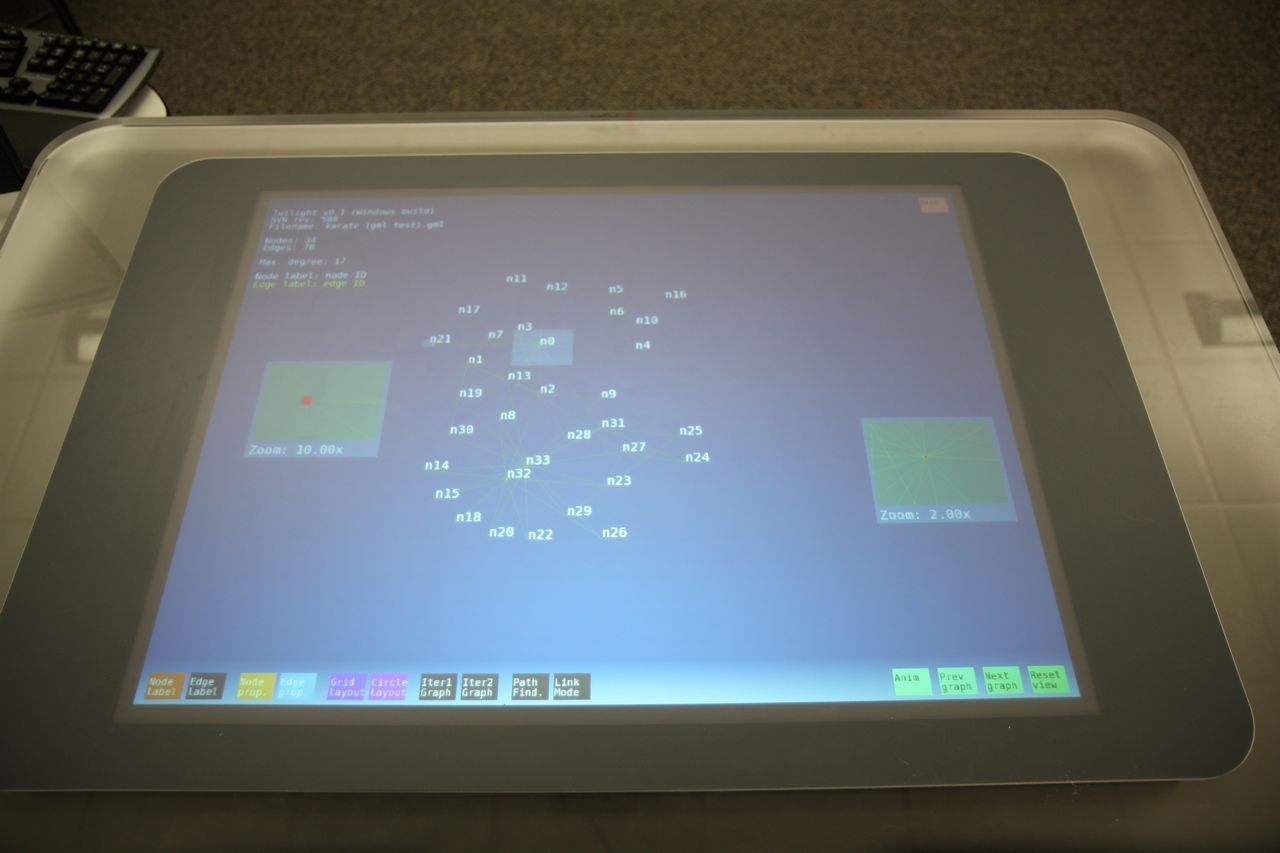
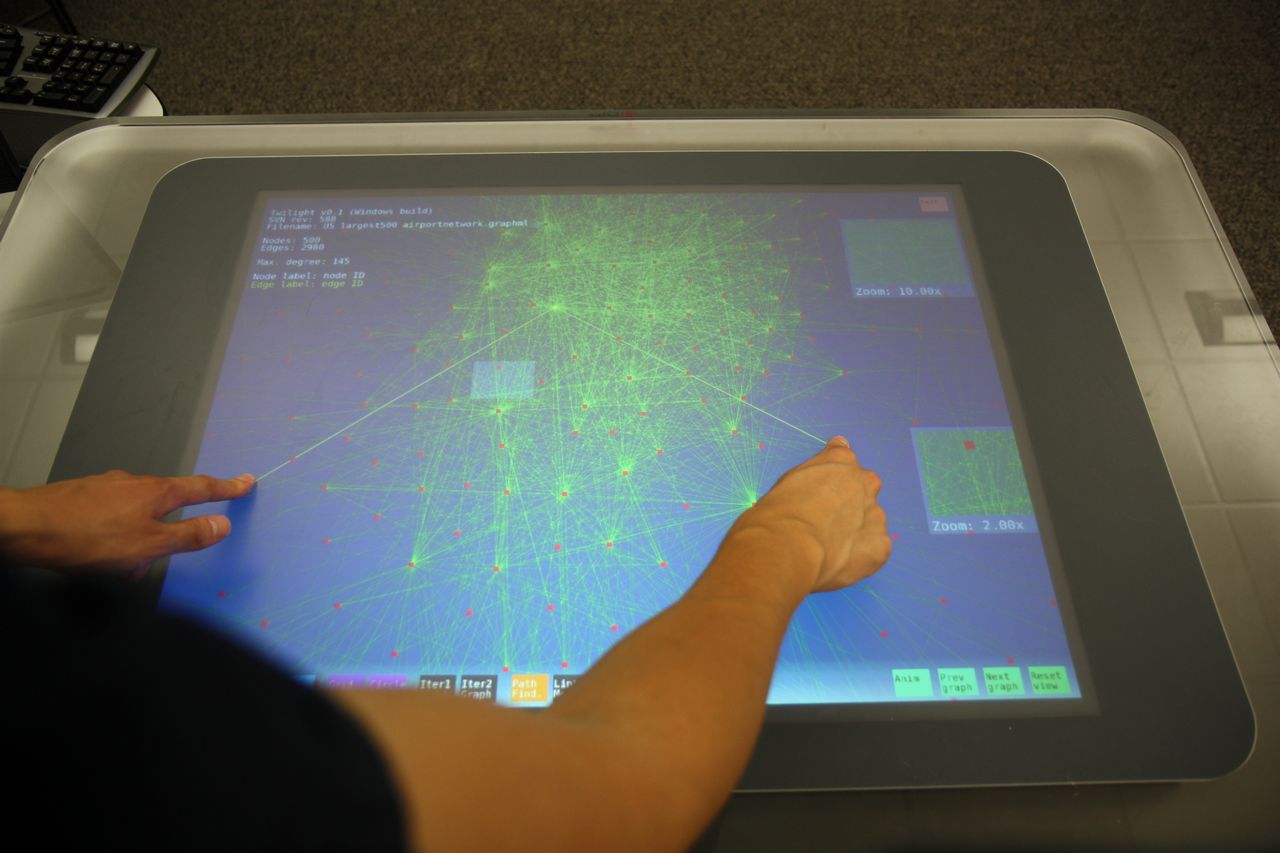
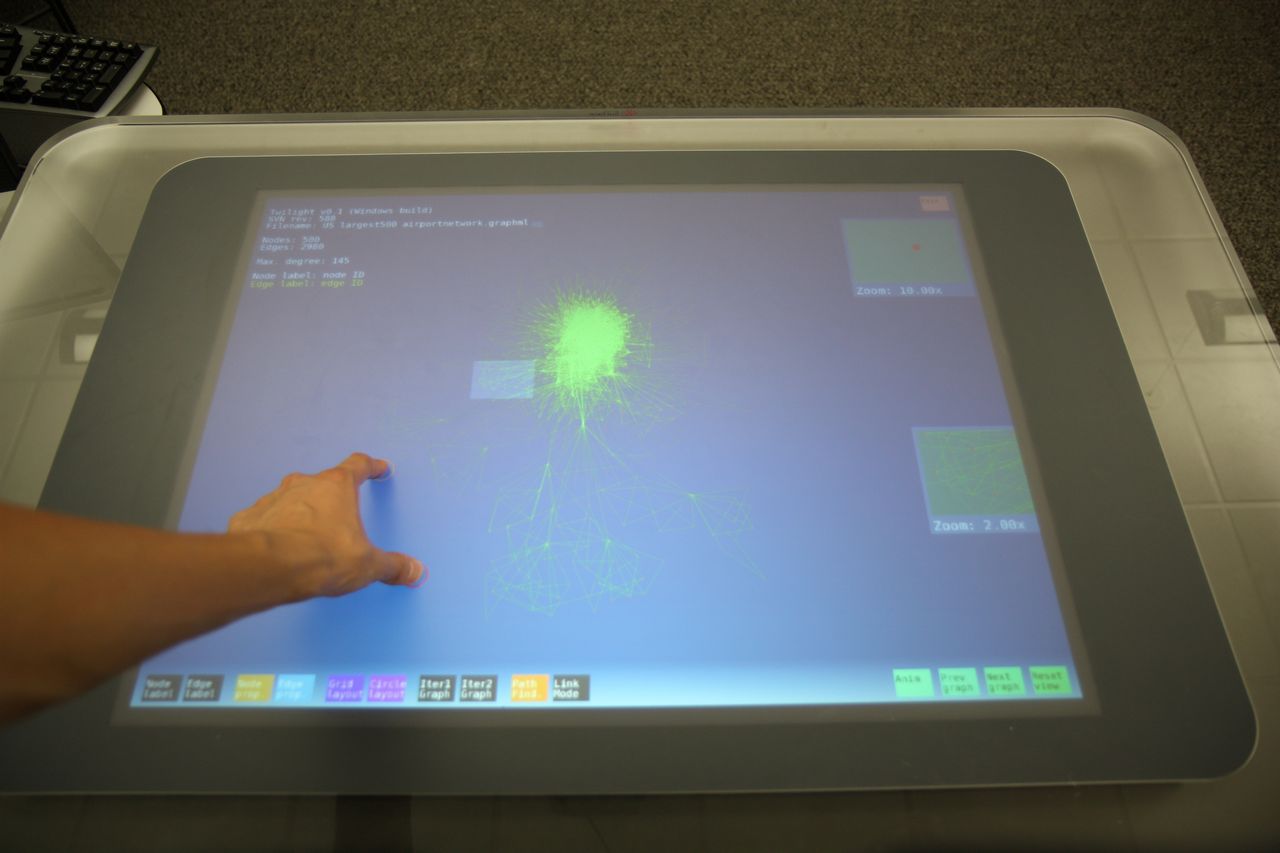
Old version of twilight